25. October 2026
teleplot 2026.10.0: Kibana dashboards without Kibana, in one binary
If your Elasticsearch data already has Kibana dashboards, you shouldn’t need Kibana to look at them. That’s the bet behind teleplot, and v2026.10.0 is the first release you can install.
Teleplot is a view-only dashboard server for Elasticsearch. It reads Kibana dashboard exports (.ndjson) and its own YAML dashboards, draws them in the browser, and only ever reads from the cluster. It ships as a single binary and targets Elasticsearch and Kibana 8.x and 9.x. It’s for anyone who has Kibana dashboards and wants a fast, read-only way to serve them. It’s also for anyone who wants an agent to write dashboards as plain files. I wrote about the agent side in When an agent can already write the file, what is an MCP server for?, and the MCP endpoint described there is part of this release.
This is the first tagged release, so there’s no previous version to compare against. It covers 61 commits, the earliest dated 2 October and the tag on 24 October.
What you can point it at
You can hand it the Kibana dashboards you already have. Export them from Stack Management → Saved Objects, drop the .ndjson into a dashboards directory, and teleplot renders them. The README shows a Kibana DORA dashboard export rendered unchanged. Two commands help with the gaps. teleplot check reports which panels of an export render, and teleplot convert turns an export into teleplot YAML if you’d rather edit it by hand. Changes to files in the dashboards directory are picked up without a restart.
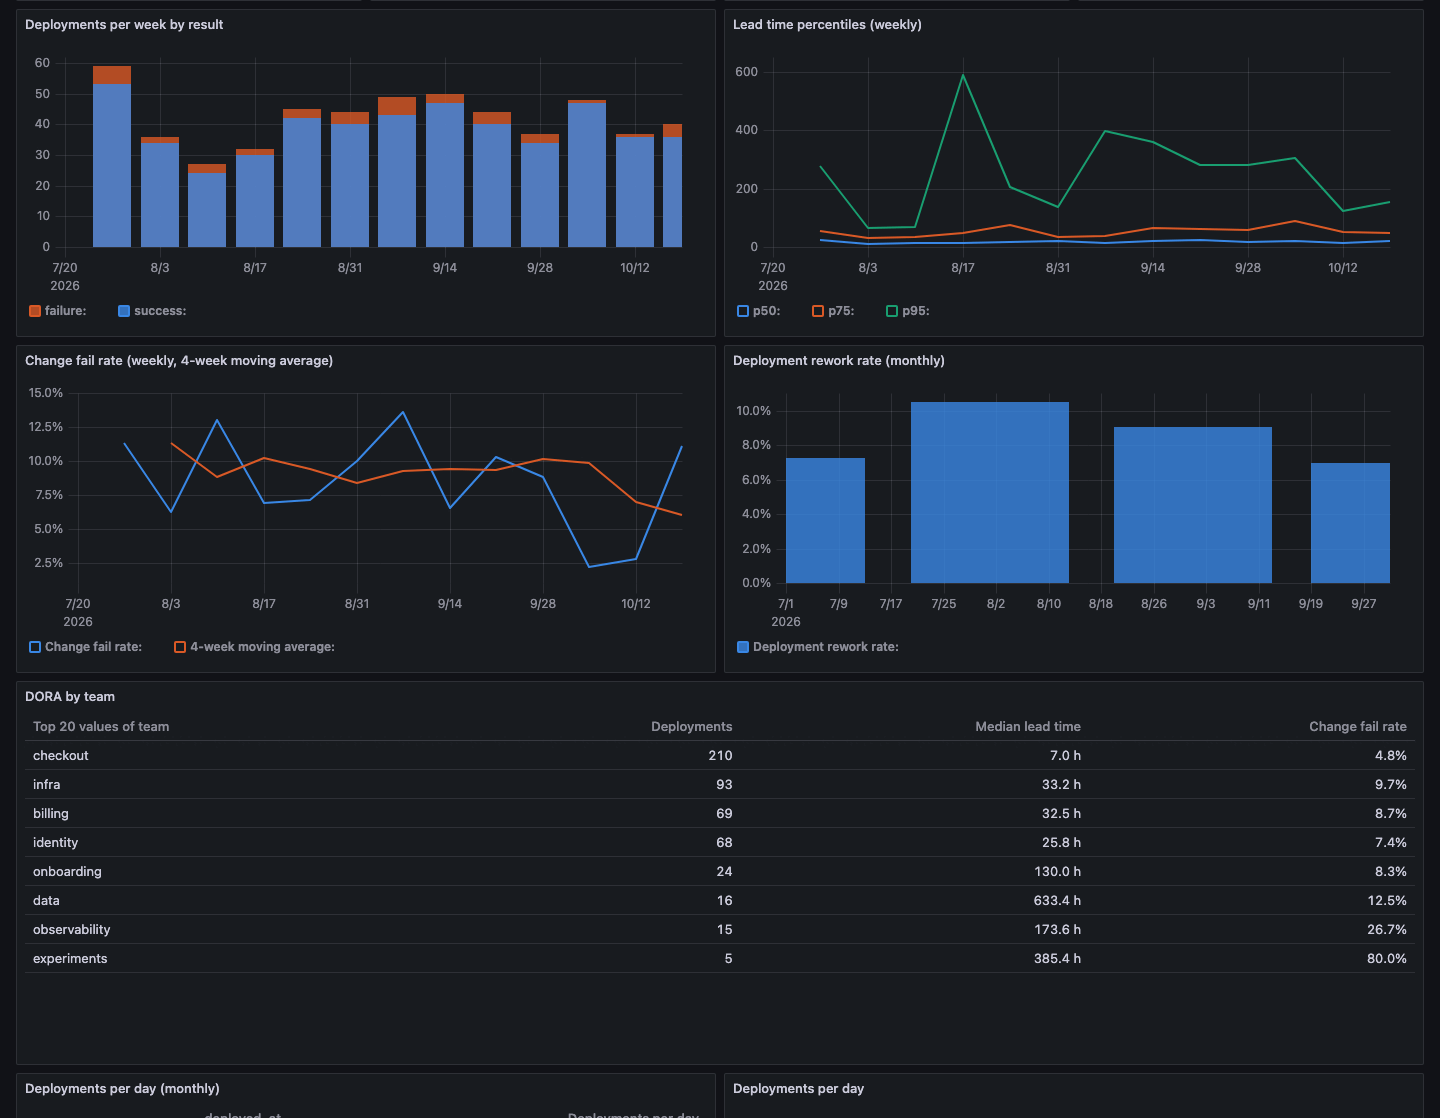
Queries run through teleplot’s own engine, which handles KQL and date math. The milestone commit says “Kibana parity”, and the repository has a make integration target for Kibana-parity tests against both Elasticsearch versions. Beyond that I’d call the parity a claim I’ve tested, not a proof. [unverified: how complete Kibana-export panel coverage is; run teleplot check on your own exports to find out]
What the charts can do
Most of the commits are charting work. Reference lines, event annotations, distribution charts, ES|QL panels, comparing a selection, chained controls and ad-hoc filters all landed in phases on 3 October. Gauges, treemaps, waffle charts, calendars, small multiples and the sparkline family followed. Lens’s “normalize by unit” is there as a column called per. A scatter chart can now plot query rows in x order with series styles.
Some changes are about being honest rather than adding chart types. Stacked category bars are sized by value instead of equally. Series are coloured by meaning, and axis labels stay whole and distinct. Panels can carry a description, shown as an info icon beside the title. A few of the chart bugs were found by building dashboards on real data, and those got fixed in the same pass.
Every chart panel has Inspect, which shows the table behind it and every Elasticsearch search it sent: request, response, time taken and matching document count. CSV downloads the same data. You can also export dashboards as PNG or PDF.
Dashboards over data that isn’t in Elasticsearch
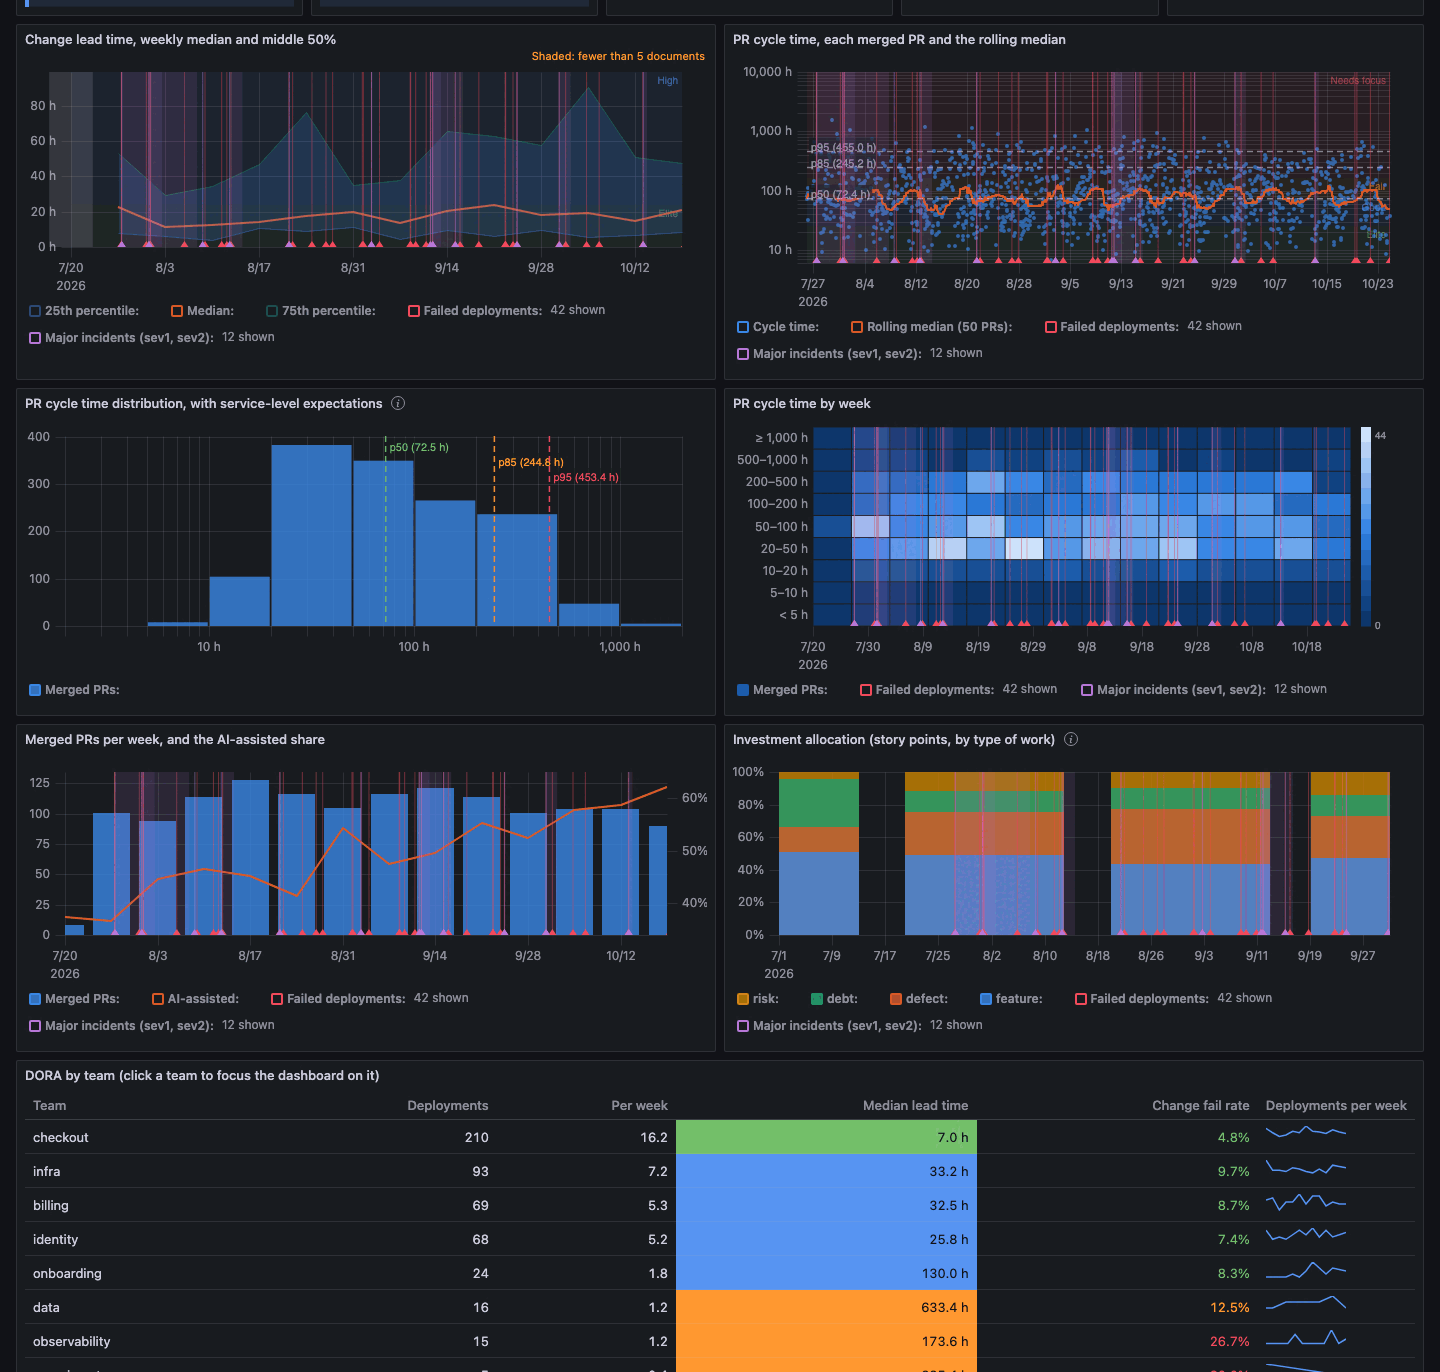
teleplot can chart the series API of insight, a source of software-analytics data. A layer with an insight block asks insight for the series rather than querying Elasticsearch. The repository’s example dashboards (Engineering overview, Commits, Code, and a duplication dashboard over mimeo’s Elasticsearch export) were built that way, and then moved to the software-analytics package. The release also includes a native Delivery Overview dashboard with DORA metrics, which is the one in the README screenshot. [unverified: what the software-analytics package is and where it lives]
For agents
teleplot mcp runs an MCP server over stdio, and teleplot serve also exposes /mcp. Agents can discover insight data. If you add mcp: { edit_dashboards: true } to teleplot.yaml, they can edit your hand-written YAML dashboards panel by panel, with comments kept and the diff returned. There’s also teleplot lint, which exits 1 on dashboard errors, and an agent skill in skills/teleplot/ that walks an agent through connecting to a cluster and checking the numbers before it hands a dashboard over.
The unglamorous part
About half of the 61 commits are CI and dependency updates: getting a seeded Elasticsearch and Kibana to come up reliably on a runner, bumping Rust to 1.99.0, and the usual crate updates. The last commits before the tag added the release pipeline and the README screenshots. None of that changes what you see, but it’s why there are now prebuilt archives to download.
Install
Download the archive for your platform from the latest release. There are builds for macOS arm64/x64, Linux arm64/x64 and Windows x64. Check it against SHA256SUMS, unpack it, and run it from any directory, because the one binary holds the UI:
teleplot serve --es http://localhost:9200 --dashboards path/to/exports
Then open http://127.0.0.1:3000. With Homebrew on macOS or Linux:
brew tap grahambrooks/teleplot https://github.com/grahambrooks/teleplot
brew install grahambrooks/teleplot/teleplot
To try it without a cluster, the README has a route from a fresh clone: start Elasticsearch with Docker, run cargo run --example seed to write about 5,400 synthetic delivery documents, then make dev. Use make dev rather than plain cargo run for the UI in a debug build, or you’ll get a blank page and a hydration error.
Since this is the first release, there’s nothing to upgrade from. The licence is Apache-2.0, and the repo has a contributing guide if you want to send something back.